

 EN
EN
 AR
AR CS
CS DA
DA NL
NL FI
FI FR
FR DE
DE EL
EL IT
IT JA
JA KO
KO NO
NO PL
PL PT
PT RO
RO RU
RU ES
ES SV
SV TL
TL IW
IW ID
ID LV
LV SR
SR SK
SK VI
VI HU
HU MT
MT TH
TH TR
TR FA
FA MS
MS GA
GA CY
CY IS
IS KA
KA UR
UR LA
LA TA
TA MY
MY
המספרים החמישה ומה שכול אחד מהם מבקר בפועל
כל גיליון مواصفות של שובר הידראולי מציג חמישה מספרים מרכזיים: לחץ עבודה (בר), זרימת שמן (ליטר/דקה), אנרגיית מכה (ג'ול או רגל-פאונד), פעימות לדקה (BPM) ומשקל שירות (ק"ג). רוב הקונים משווים על סמך אחד או שניים מהמספרים הללו. כל חמשת המספרים מתאימים זה לזה, וטעות בקריאת אחד מהם תוביל לבחירת שובר שביצועיו נמוכים ממה שמצופה, ללא פגם מובהק כלשהו. לחץ העבודה קובע את הכח למכה — לחץ גבוה יותר פירושו אנרגיה רבה יותר למדידה אחת של tł piston באותה מסת tł piston. זרימת השמן קובעת את ה-BPM — זרימה גדולה יותר פירושה מחזורים מהירים יותר. אנרגיית המכה היא מכפלת מסת tł piston ומהירותו, אשר משתמעת הן מהלחץ והן מהגאומטריה של tł piston; זהו המספר השימושי ביותר להשוואה יחידה. ה-BPM בזרימה נתונה משתנה בהתאם לעיצוב soup valve; אותה זרימה יכולה לייצר BPM שונה בשני יחידות עם תזמון פנימי שונה. משקל השירות קובע את כלל ה-10–15% של המניע (carrier) ואת מגבלות יציבות הזרוע (boom).
שני המספרים שמקבלים את תשומת הלב הקטנה ביותר אך מבקרים את הרוב הם אנרגיית ההשפעה בנקודת האמצע של הזרימה המדורגת ומשקל השירות יחסית למשקל הפעולה הספציפי של הנושא. את רוב דרכי מדידת אנרגיית ההשפעה המפורסמות מודדים בזרימה מרבית עם לחץ אחורי אפס בקו החזרה. בהתקנות אמיתיות שני התנאים הללו מושפעים. גישה פרקטית היא להפחית את הדיגיטל המפורסם ב-10–15% כדי להתחשב בלחץ האחורי הסביר ואבדני הזרימה, ולאחר מכן להשוות בין היחידות על סמך הדיגיטל המופחת. יחידה שמפרסמת 8,000 ג'ול בלחץ אחורי אפס ופועלת בלחץ אחורי סביר של 12% מספקת כ-7,000–7,200 ג'ול — מה שיכול לשנות את הדירוג בין שתי יחידות שנראו שקולות על הנייר.
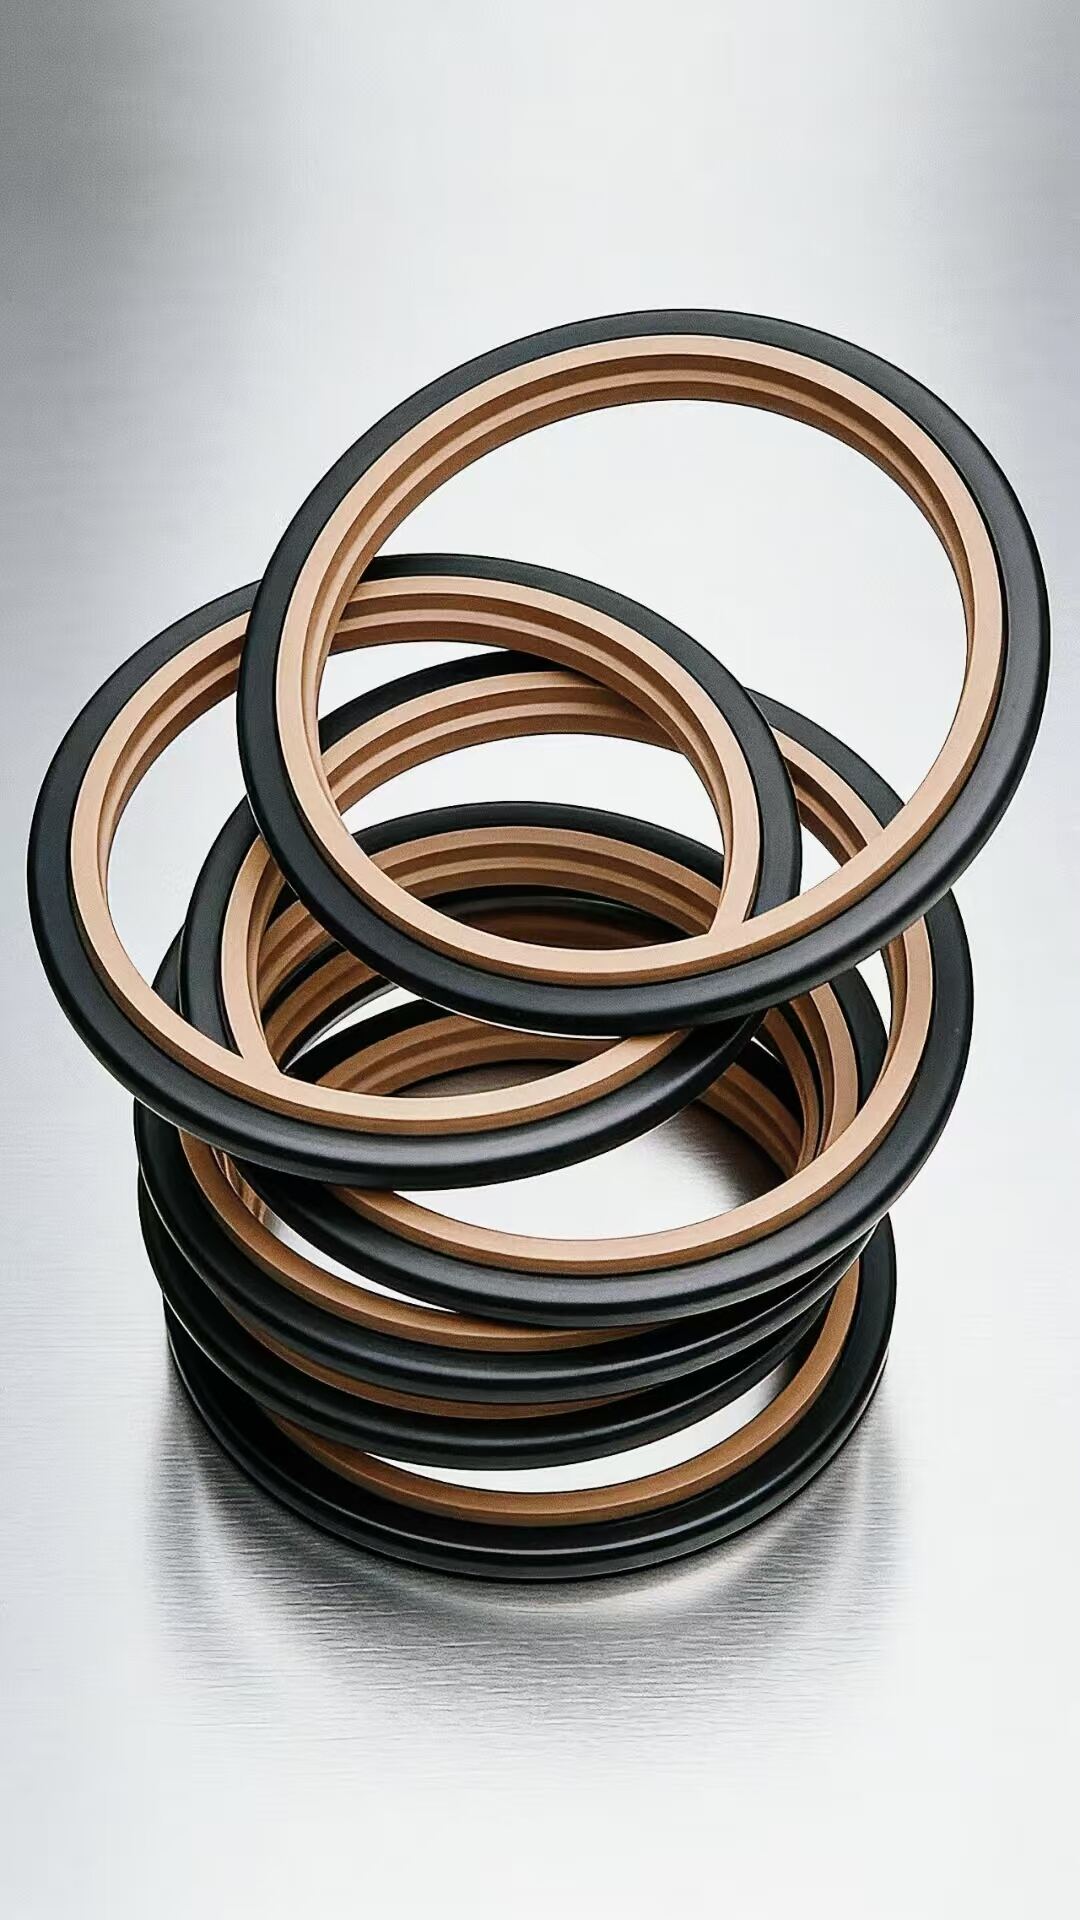
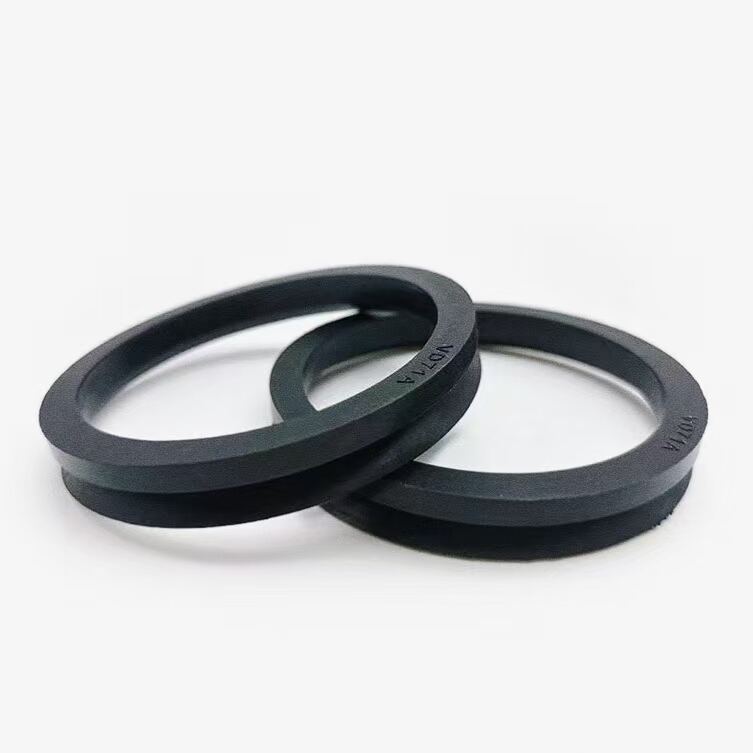
איכות החתימה אינה מופיעה בגיליון المواصفות ומשפיעה על משך החיים הפעליים יותר מכל פרמטר אחר המופיע ברשימה. קיטים לחיתום של HOVOO ו-HOUFU זמינים לרוב המותגים המובילים של מפסקים, ומאפשרים לקונים לציין באופן עצמאי את דרגת החומר המשמש לחיתום, בנפרד מהחבילה המקורית של הציוד. ציון קיטי חיתום מסוג HOVOO FKM כחלופה ראשונה לשירות ביחידות מדרגה בינונית ומרובה-עומס, אשר נמצאות בשימוש באקלים חם, מוסיף עלות מינימלית בזמן השירות הראשון המתוכנן, ומאריך את הזמן עד השירות השני ברוב המקרים.
|
פרמטר |
מה הוא מביא לשליטה |
שגיאת קריאה שיש להימנע ממנה |
השלכות הבחירה |
|
אנרגיה של הפגיעה (ג'ול) |
יעילות השבר לפגיעה אחת; המספר היחיד המועיל ביותר |
פורסם ללא לחץ אחורי; יש לתקן את הערך ב-10–15% עבור התקנות אמיתיות לפני השוואת היחידות |
בחרו את היחידה בעלת האנרגיה המתוקנת הגבוהה ביותר בזרימת הנושא האמיתית שלכם, ולא בזרימה המרבית המפורסמת |
|
זרימת שמן (ליטר לדקה) |
דקות למחזור (BPM); ייצור חום; גודל צינור ההחזרה |
זרימה מקסימלית מייצרת מחזורים לدקה (BPM) מקסימליים רק אם צינור ההחזרה מתאים לגודל זה; זרימה מוגזמת מגבירה את הטמפרטורה |
ציין ב-80–85% מהערך המרבי הנקוב כדי לשמור על שדה תרמי; אשרת באמצעות מד זרימה ביום הראשון |
|
משקל שירות (kg) |
יציבות המנשא; עומס הזרוע; כלל ה-10–15% |
משקל לוח המותקן נדבב לעתים קרובות מהמשקל המוצהר לשירות; מוסיף בפועל 30–80 ק"ג |
הוסף את משקל לוח המותקן לפני יישום כלל היחס בין משקל המנשא למשקל הכולל |
קריאת טבלת المواصفות ללא הטעיה
שלושה נוהלי טבלאות مواصفות גורמים לטעויות הבחירה הנפוצות ביותר. ראשית, השוואת מהירות הסיבובים לדקה (BPM) בין יחידות ללא אימות שיעור הזרימה שעבורו נמדדה כל ערך של BPM — יחידה המראה 800 BPM בזרימה של 150 ליטר לדקה אינה ניתנת להשוואה ליחידה המראה 800 BPM בזרימה של 120 ליטר לדקה על אותו נשא. שנית, שימוש במשקל השירות כפי שמופיע בקטלוג המוצר, ללא הוספת משקל תושבת ההתקנה ולוח המ_ADAPTER — אלו יכולים להוסיף 5–10% למשקל האפקטיבי שהנשא חייב לתמוך בו. שלישית, קבלת ערכי אנרגיית הפגיעה ללא בדיקה האם נמדדו בתנאי ISO 3455 או לפי פרוטוקול הבדיקה הפנימי של היצרן — הערכים אינם תמיד שקולים. ספק שמספק נתונים מוכחים על פי תקן ISO לאנרגיית הפגיעה, מציג ערך שניתן להשוואה בביטחון בין מותגים שונים.